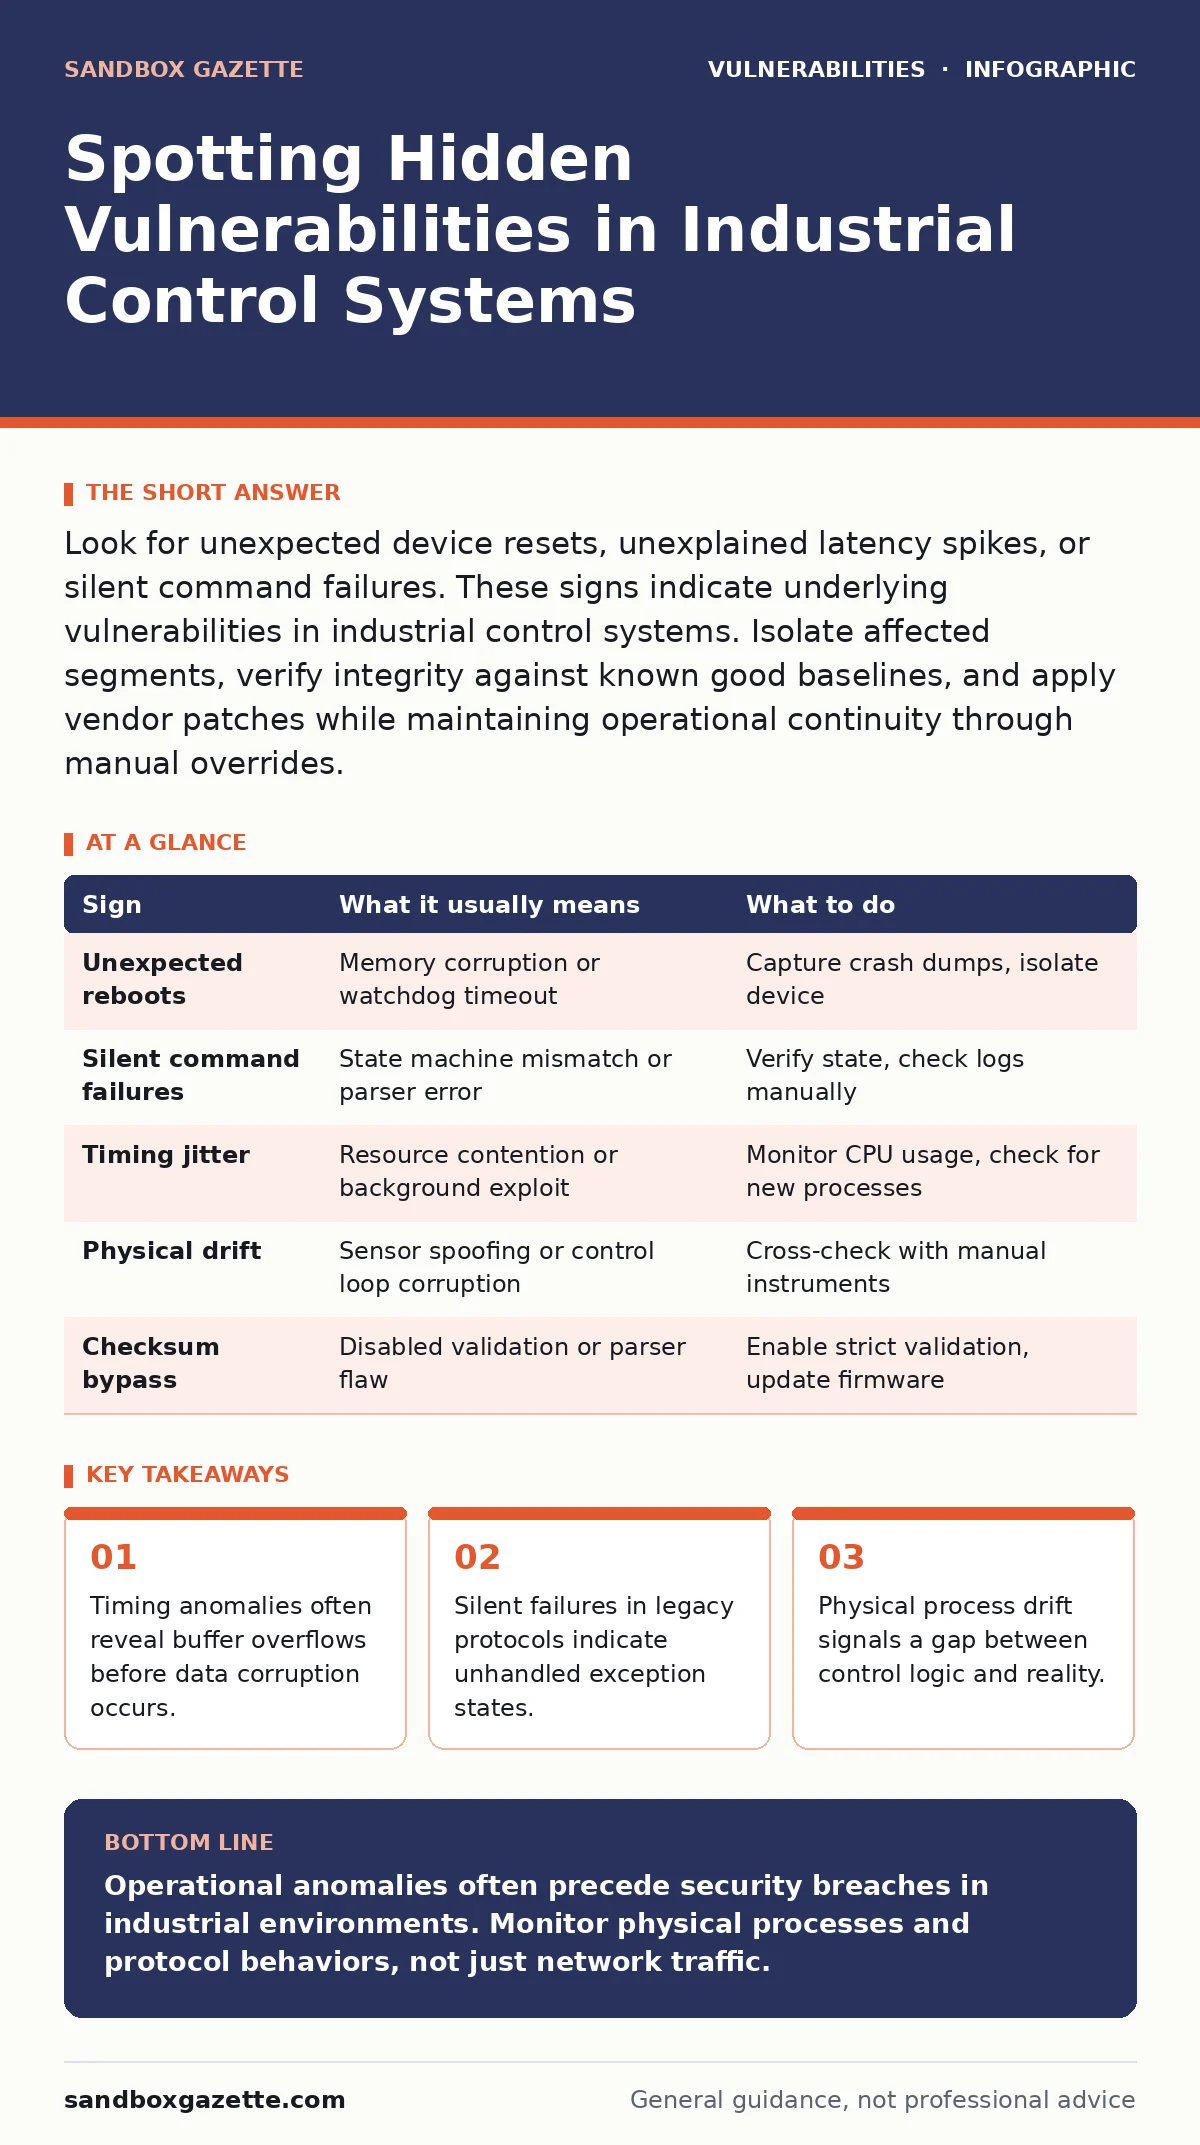
Look for unexpected device resets, unexplained latency spikes, or silent command failures. These signs indicate underlying vulnerabilities in industrial control systems. Isolate affected segments, verify integrity against known good baselines, and apply vendor patches while maintaining operational continuity through manual overrides.
Immediate Operational Anomalies
Device resets appear without scheduled maintenance. You see a programmable logic controller rebooting unexpectedly. This behavior often signals a memory corruption event or a watchdog timer triggering due to a stuck process. The system recovers, but the root cause remains active.
Latency spikes occur during routine cycles. A valve opens milliseconds later than programmed. This delay suggests network congestion from malformed packets or a processor struggling to handle an unexpected data structure. The process continues, but precision degrades.
Unexpected command rejections happen. A human operator sends a valid stop command, and the system ignores it. This indicates a state mismatch where the controller believes it is already stopped. The vulnerability lies in the state machine logic, not the network path.
Subtle Protocol Irregularities
Silent failures mask data loss. You send a configuration update, and the device acknowledges receipt. The configuration does not change. This happens when a parser drops fields it cannot interpret. The acknowledgment confirms transport success, not application success.
Checksum mismatches appear rarely. Packets arrive with invalid integrity checks, but the receiver processes them anyway. This indicates a disabled validation routine. Attackers exploit this by injecting malicious payloads that bypass standard verification.
Timing jitter increases slightly. The interval between sensor reads varies by fractions of a millisecond. This variation suggests resource contention. A background process is consuming cycles, potentially hiding a long-running exploit or a resource exhaustion attack.
Physical Process Drift
Temperature readings diverge from set points. The heater is on, but the temperature rises slower than expected. This drift indicates a sensor spoofing attack or a corrupted control loop. The system believes the temperature is correct because it trusts the sensor data.
Flow rates fluctuate without cause. Pumps run at constant speed, but flow meters show variance. This discrepancy suggests interference with the communication bus. The controller receives false data and adjusts outputs incorrectly.
Pressure anomalies occur in closed loops. Pressure builds or drops without valve movement. This signals a failure in the feedback mechanism. The controller cannot correct the error because the error signal is missing or altered.
Diagnostic Response Protocol
Isolate the affected segment immediately. Disconnect the vulnerable device from the operational network. This prevents lateral movement while preserving the state for analysis. Do not power cycle the device unless safety requires it.
Capture network traffic. Record all packets to and from the device. This data reveals the exact sequence of events. Use this capture to reconstruct the attack path or identify the malformed packet causing the issue.
Verify integrity against baselines. Compare current configurations and memory dumps to known good states. This identifies what changed. Focus on unexpected modifications to system files or registry entries.
Table of Warning Signs
| Sign | What it usually means | What to do |
|---|---|---|
| Unexpected reboots | Memory corruption or watchdog timeout | Capture crash dumps, isolate device |
| Silent command failures | State machine mismatch or parser error | Verify state, check logs manually |
| Timing jitter | Resource contention or background exploit | Monitor CPU usage, check for new processes |
| Physical drift | Sensor spoofing or control loop corruption | Cross-check with manual instruments |
| Checksum bypass | Disabled validation or parser flaw | Enable strict validation, update firmware |
See also: Bug Bounty Triage: How Reports Move From Inbox to Fix · Asset Inventory for Patching: Why You Can't Fix What You Can't Find
Integration With Security Programs
Connect these observations to your vulnerability management programs. Standard scanners miss operational technology flaws because they cannot interpret industrial protocols. Manual monitoring fills this gap.
Review your configuration hardening strategies. Many vulnerabilities arise from default settings that allow unsafe behaviors. Tighten access controls and disable unused services. This reduces the attack surface significantly.
Consider threat modeling for applications. Understand how an attacker might abuse the protocol logic. This perspective helps you identify signs that automated tools overlook. Focus on logic flaws, not just code errors.
Long-Term Mitigation Strategies
Patch management requires care. Applying updates to live systems risks downtime. Test patches in an isolated environment first. Verify that they do not break existing automation sequences.
Monitor for n-day vulnerabilities. These are flaws with public exploits. Attackers target these quickly because the fix is known. Prioritize patching these over theoretical risks.
Use dynamic application security testing (DAST) cautiously. Active scanning can disrupt production systems. Limit testing to maintenance windows or isolated replicas. Ensure you have a rollback plan.
Handling Complex Vulnerability Types
Some flaws involve out-of-bounds write vulnerabilities. These allow an attacker to overwrite memory adjacent to the target buffer. The signs are subtle, often just random crashes or data corruption.
Path traversal vulnerabilities allow access to files outside the intended directory. You might see unexpected file reads or writes. This indicates a failure in input validation. Check all file path inputs rigorously.
CVE identifiers help track these issues. When a vendor releases a fix, note the identifier. Use this to search for similar flaws in your environment. This proactive approach prevents future incidents.
Conclusion of Detection Methods
Vulnerabilities in industrial control systems manifest in operational behavior. You must look beyond network logs. Physical processes and timing data reveal what packets hide.
Integrate these checks into daily routines. Train operators to report anomalies, no matter how minor. Early detection prevents escalation. Continuous monitoring builds resilience against evolving threats.
Key takeaways
- Timing anomalies often reveal buffer overflows before data corruption occurs.
- Silent failures in legacy protocols indicate unhandled exception states.
- Physical process drift signals a gap between control logic and reality.
Operational anomalies often precede security breaches in industrial environments. Monitor physical processes and protocol behaviors, not just network traffic.
Frequently asked questions
How do I distinguish between a hardware fault and a vulnerability?
Hardware faults usually repeat consistently under the same load. Vulnerabilities often trigger only with specific data patterns or timing. Analyze the input data during the fault.
How often should I update baseline data?
Update baselines after any configuration change or process modification. Seasonal variations or maintenance activities can shift normal parameters significantly.
How this guide was produced: written by the Sandbox Gazette editorial team with AI assistance, checked against the public references listed below, and reviewed when the facts change. See our editorial policy or report an error.